Last Friday was anything but your typical Friday. Waking up early to the sweet sounds of raccoons pillaging garbage is never the way to start one’s day. But there I was, lying in bed…thinking about my garbage…first thing in the morning. I begrudgingly got up, walked down the stairs and over a present that my cat decided to leave me during the middle of the night. I opened the front door and to my surprise, everything was still in tact! What a relief. I got lucky there, but school drop-offs were next, and if history is any indicator, this could be anything but smooth.
Three quarters of the way to school drop-off I realized had left my mobile at home on my bedside table.
‘Probably a good thing,’ I thought to myself. ‘They do say it is good to disconnect from the notification bliss we receive every now and then. Plus it’ll reduce my app usage stats, and according to Apple that can only be a good thing. However, I do love listening to music while I walk around…maybe i’ll go back and get it.’
After I dropped off the kids, I went back to the house, grabbed my phone and laptop and then strolled down the Danforth pondering what to do with my day. I walked past a nice local coffee shop called Red Rocket Coffee.
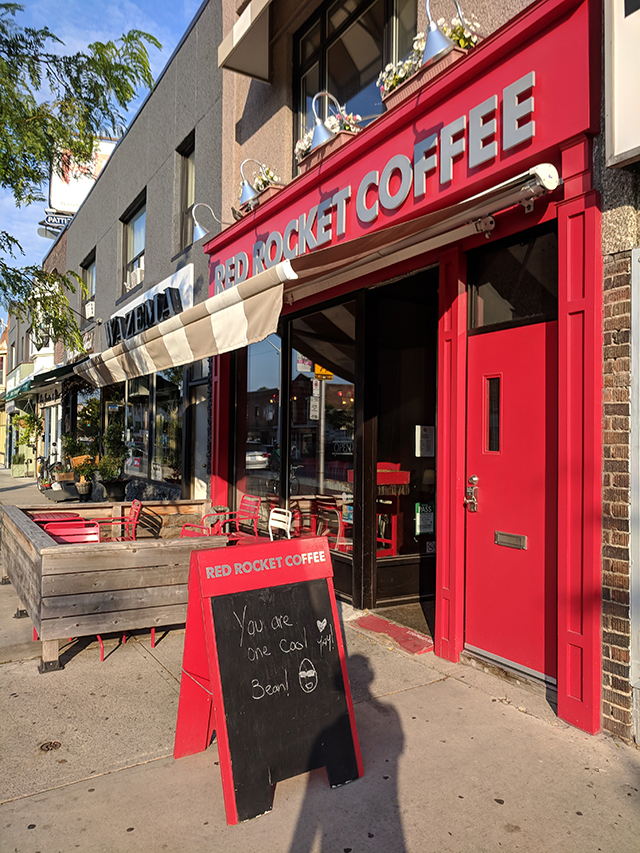
I really like this place and have been here a few times before. I will most definitely hack from this coffee shop today. So, I ordered a flat white and a cookie and then settled down to explore the wonderful world of python.
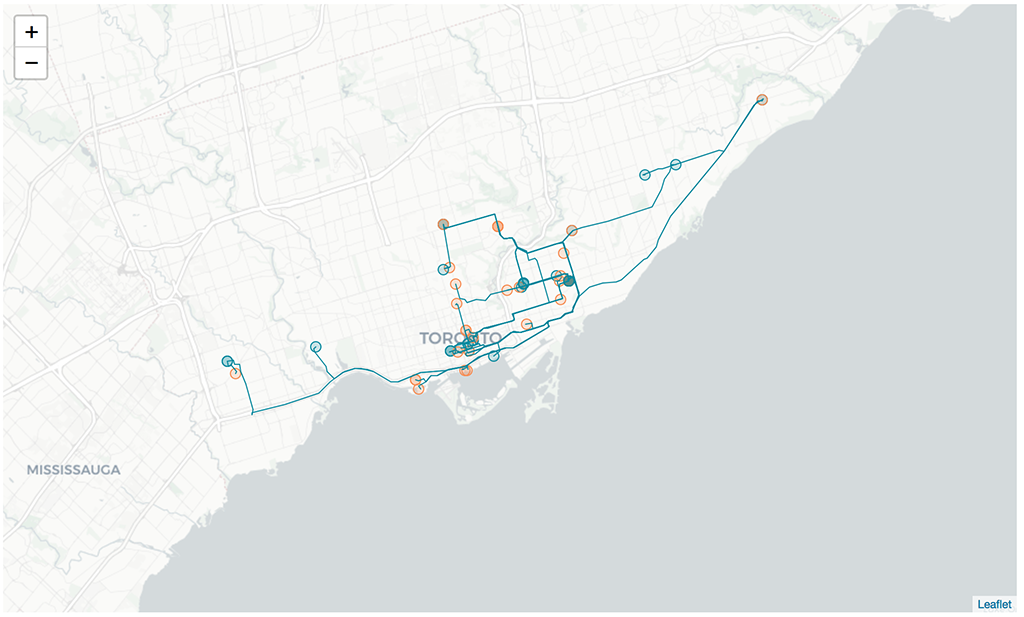
It wasn’t long before I figured out how to extract and visualize my ride sharing history on a folium map. I’m not sure why I really decided to do this, but I kind of wanted to know what this data would look like. This was kinda neat! Some people may not necessarily share this info, but it’s interesting to be able to figure out how to visualize multiple routes on a map. I wonder what else I can do?
Feeling pretty proud of the map I made, I decided to go home and observe a new tradition I picked up over the summer while in Spain – the Siesta. With that mid afternoon nap calling my name, I quickly packed up my bags and was halfway out the door when suddenly I realized the long walk home was perhaps a little too long.
‘Maybe I’ll just rent a bike,’ I thought to myself. ‘I could just Google directions to find the nearest one…’
OR…
‘I could build a jupyter notebook leveraging Open Data from the City of Toronto and use python to help me determine which station is the closest!’
So there i was, the proverbial fork in the road. A decision needed to be made.
On one side: There was Google, with all the magical things that it can do.
On the other side: A python rabbit hole potentially so deep, I may need a blue pill just to get out of it.
Ok, the python rabbit hole does sound like fun and I do have some time at the moment, so why not.
The Game Plan
Before I get started, let’s put together a quick game plan for what needs to be done. I’ll need to:
- Import Relevant Libraries
- Import Data from the City’s Bike Share Program (Bike Stations & Availability)
- Determine my current latitude and longitude while at the coffee shop
- Create a function to determine the closest stations by latitude and longitude
- Create a Function that determines bike availability at the closest stations
- Plot myself and the closest stations on a folium map
- Plot route to the closest station with bike availability
- Leave coffee shop and rent the bike!
Ok. The plan is ready. Let’s get started!
Importing Libraries…check!
import pandas as pd
import folium
from folium import plugins
import geopy.distance
from datetime import datetime
import openrouteservice                 # Used to get lat / longs in between starting and ending lat / long
from openrouteservice import convert
Time to Import this Data
Next up, let’s import a few open datasets from the City of Toronto’s website:
- A json list of Bike Share Stations
- A json list of each Bike Share Station’s status (ie. how many bikes each have available)
Let’s read each json file and store them into a dataframe.
First up – retrieving information about all bike share stations in the City of Toronto
stations = pd.read_json('https://tor.publicbikesystem.net/ube/gbfs/v1/en/station_information', lines=True)
# Let's see what we have
stations.head()
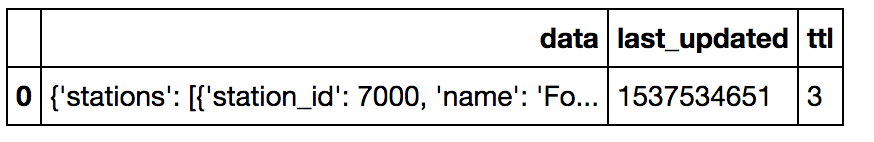
Let’s now take a look when this data was last updated.
datetime.utcfromtimestamp(1537476761).strftime('%Y-%m-%d %H:%M:%S')
Outputs:
# Great! Looks up to date!
'2018-09-20 20:52:41'
Ok. Now let’s parse what is in stations[‘data’] to get at the information and store it into its own dataframe.
station_attr = stations['data'][0]['stations']
station_attr = pd.DataFrame(station_attr)
station_attr.head()
Outputs:
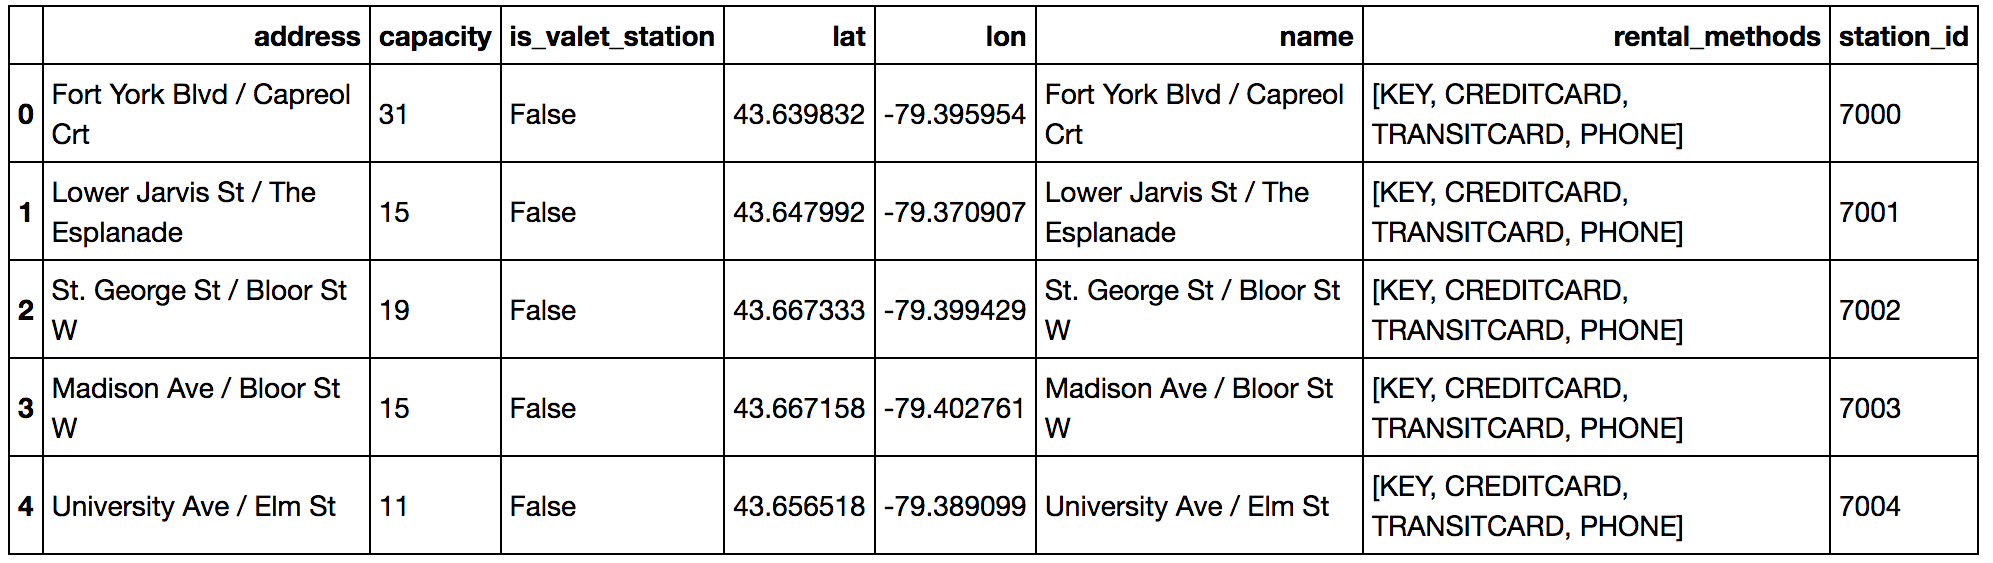
This looks great! I can work with this.
Next up: Let’s import a json list of each Bike Share Station’s status
This data will give me information on the number of bikes that are currently available, among other metrics. We’ll repeat the same steps as above.
station_status = pd.read_json('https://tor.publicbikesystem.net/ube/gbfs/v1/en/station_status')
station_status_each = pd.DataFrame(station_status['data']['stations'])
station_status_each.head()
Outputs:
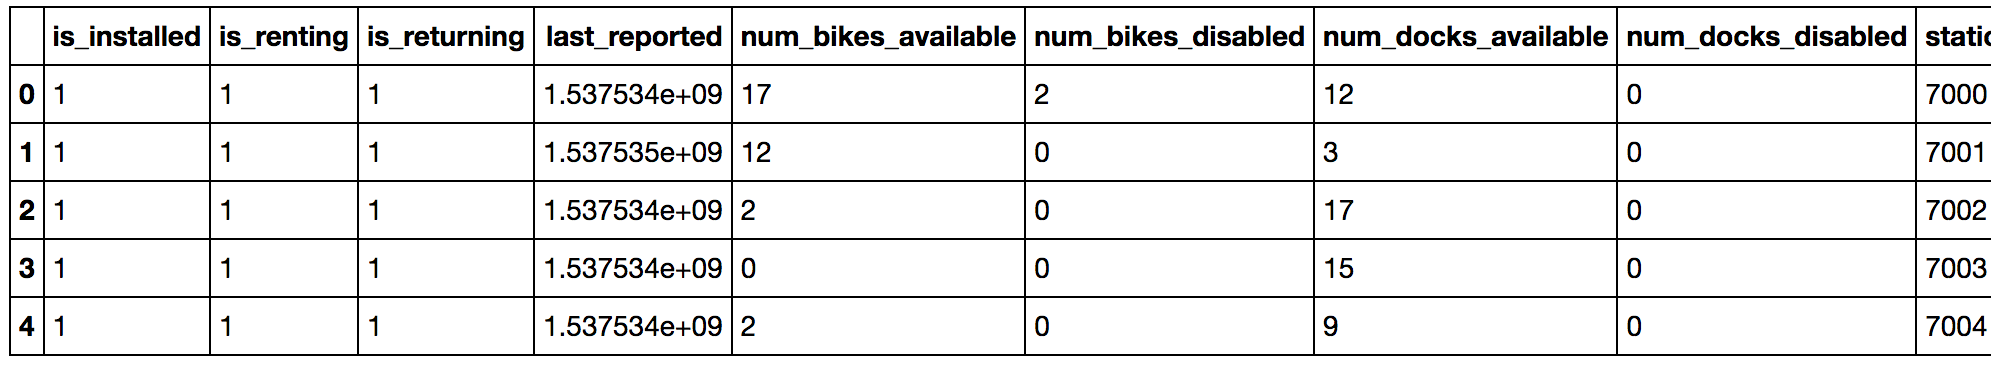
We can also transform the last_reported column into a datetime using:
# Let's create a new column which converts last_reported into a timestamp.
station_status_each['latest_report'] = datetime.utcfromtimestamp(station_status_each['last_reported'][0]).strftime('%Y-%m-%d %H:%M:%S')
Now let’s generate my latitude and longitude coordinates
I’m going to use this data to then calculate the distance between my coordinates and all of the coordinates of each bike share station.
I’ll then find the closest station by taking the minimum distance between my coordinates and the lucky station in my array of distances.
To save some time, I’m going to quickly generate my lat long using the following tutorial on MDN:
https://developer.mozilla.org/en-US/docs/Web/API/Geolocation_API
# Now let's store latitudes and longitudes these into the following variables.
myLat = 43.6823098050454
myLon = -79.3283423644293

# I'll pass mycoord into a function that will help me find the closest stations to my position.
mycoord = [myLat,myLon]
Let’s create a function that will find the closest station to my coordinates
To do this we’ll use geopy.distance and return a list of each station’s distance to my coordinates in kilometers (km). I also need to calculate the shortest distance to determine the closest to myself.
def get_closest_stn(mycoord):

    '''
    Background: Return a list of the closest stations in order

    Args:
    mycoord: My lat/ long coordinates

    Return
    distances_to_all: a sorted list of the closest station
    closest_stn: the closest station

    '''

    distances = []

    for index, row in station_attr.iterrows():

        #coordinates of the station
        slat = row['lat']
        slong = row['lon']

        # need to pass sgeo into geopy function below
        sgeo = (slat,slong)

        # additional detail about the station to return
        sid = row['station_id']
        sname = row['name']
        capacity = row['capacity']
        rental_method = row['rental_methods']

        # Calculate the distance
        distance = geopy.distance.vincenty(mycoord, sgeo).km
        distances.append([sid, distance, sname, capacity, rental_method, slat, slong])

    distances_to_all = distances
    # sort all stations by distance to my coord
    distances_to_all.sort(key=lambda tup: tup[1])
    closest = min(distances, key=lambda x: x[1])

    print('Information about the closest station to you:')
    print('The closest station to you is station # {}, which is located at the intersection of {}.'.format(closest[0], closest[2]))
    print('This station is {} km away from your present location.'.format(round(closest[1],2)))

    return distances_to_all, closest
Let’s call the function to see what bikeshare station is closest to me:
distances_to_all, closest_stn = get_closest_stn(mycoord)
Information about the closest station to you:
The closest station to you is station # 7090, which is located at the intersection of Danforth Ave / Lamb Ave.
This station is 0.1 km away from your present location.
Now let’s create a function that can tell me about the closest stations current status (ie. how many bikes is currently available at its location.
def station_status(closest_station):

    '''
    Background: Query a station and return stats about it (ie. # of bikes available)

    Args:
    closest_station: station you want to get info on

    Return:
    station_stats: a df filtered to the specific station you are looking for stats on

    '''

    # Use the id to get the latest update from the station i want to rent a bike there.
    station_stats = station_status_each[station_status_each['station_id'] == closest_station].copy()

    print('Current Station Status:')
    print('Last Updated on: {}'.format(station_stats['latest_report'].values[0]))
    print('Number of bikes currently available at station #{}: {}'.format(station_stats['station_id'].values[0],station_stats['num_bikes_available'].values[0]))
    print('Number of bikes currently disabled at this station: {}.'.format(station_stats['num_bikes_disabled'].values[0]))

    #latest_update = [station_stats['num_bikes_available'],station_stats['num_bikes_disabled'],station_stats['latest_report']]

    return station_stats
Let’s pass the closest_station[‘0’] id into the station_status function to return a few stats about the closest station
need_data_on_this_stn = closest_stn[0]
new_df = station_status(need_data_on_this_stn)
That sucks. No bikes at that station. Let’s just map the top 5 stations closest to me and visualize each of their status. We’ll display a green circle if the station has > 1 bikes available to rent and red if the station has no bikes.
Time to Generate a Map!
Now on to the fun stuff and start visualizing my coordinates and the closest bike share stations to the coffee shop.
# New map
folium_map = folium.Map(location=[myLat,myLon],
                        zoom_start=15,
                        tiles="cartodbpositron")
Let’s add my coordinates as a Marker to the map:
# My coordinates
folium.Marker(location=(myLat,
                        myLon),
                        popup='<b>You are here</b>'
                        ).add_to(folium_map)
Call the map.
folium_map
Outputs me on the map!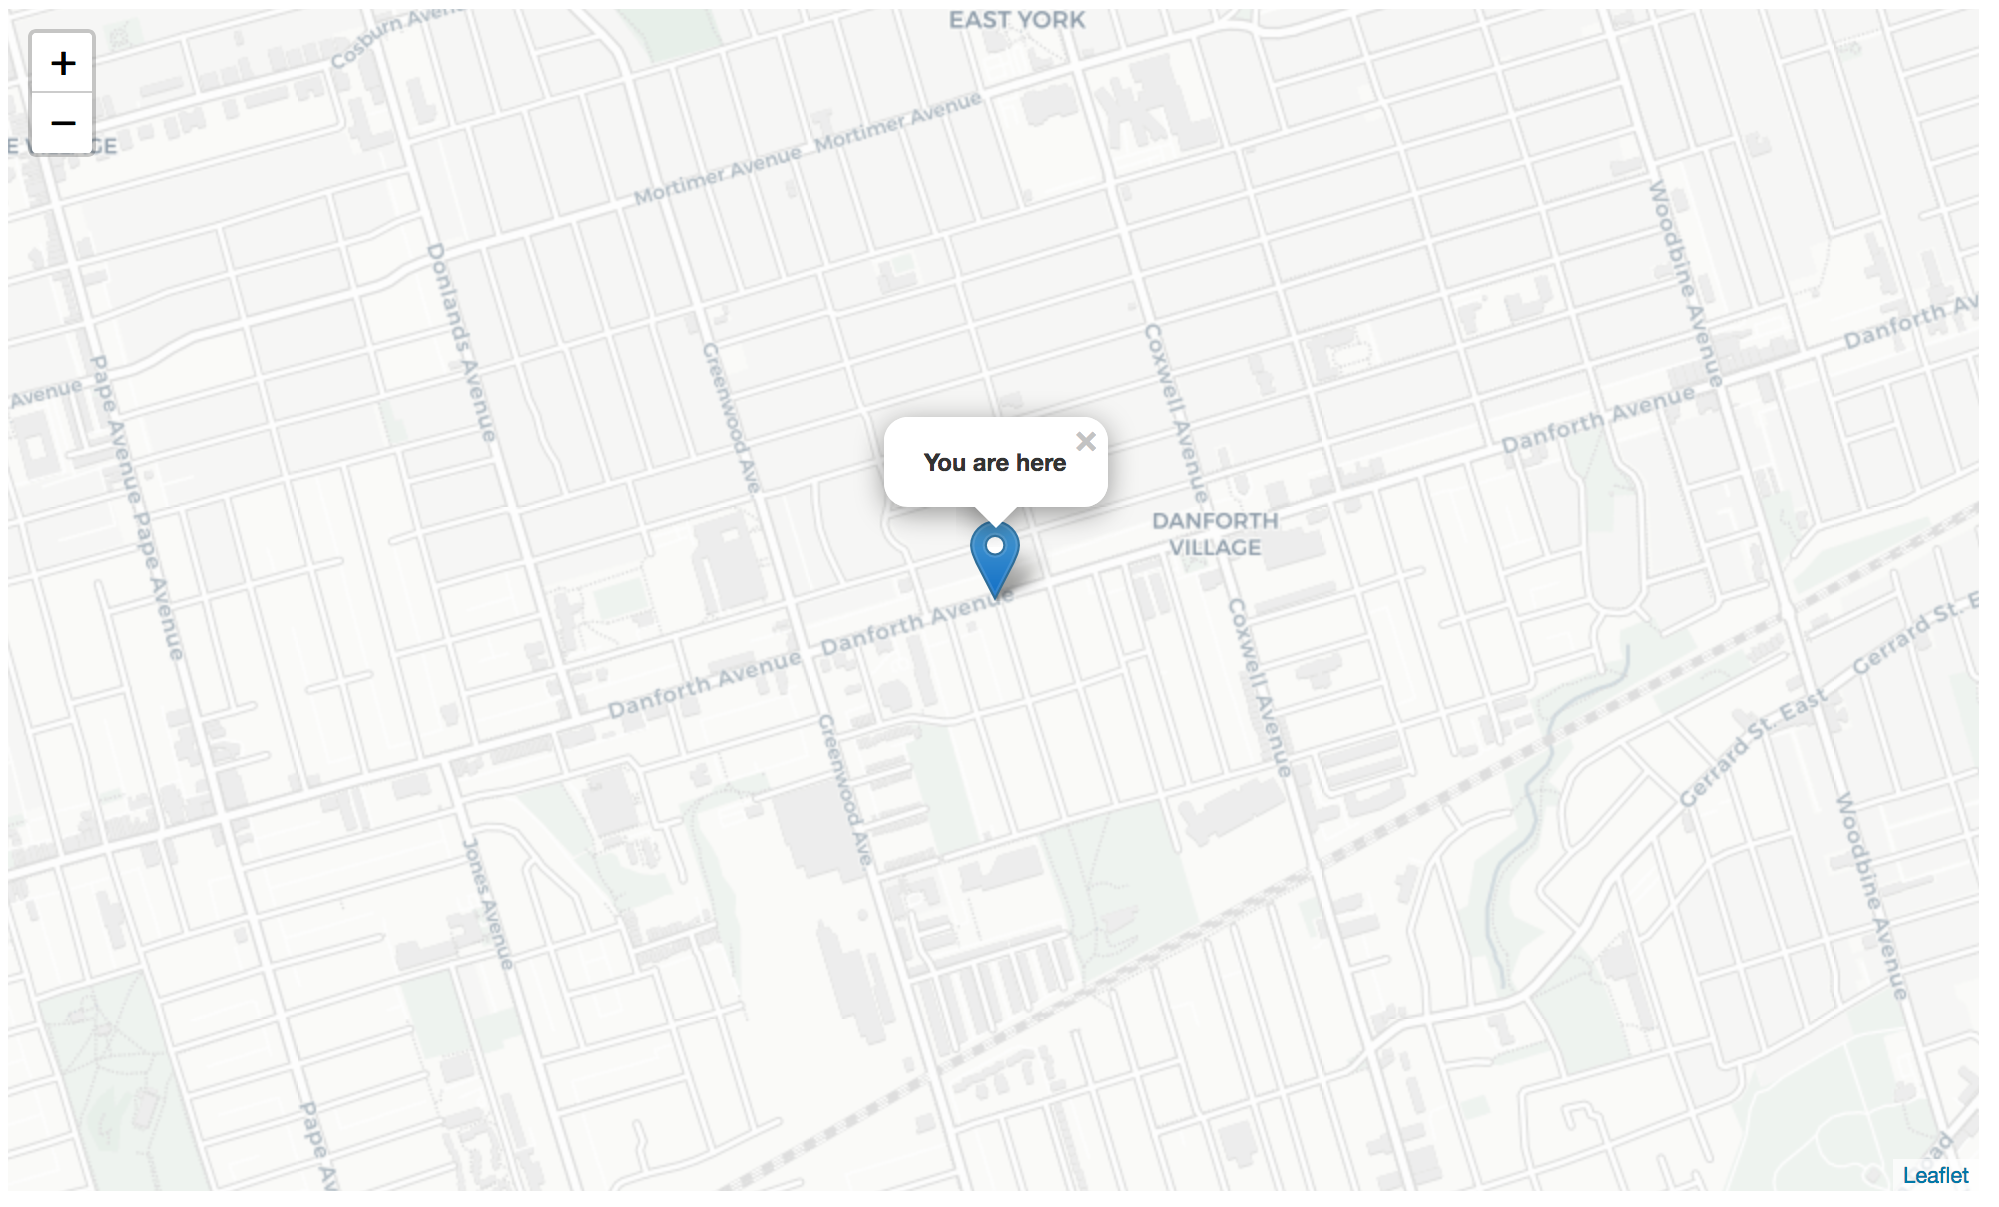
Now let’s create a function to plot the top 5 closest stations to the coffee shop.
def plot_top_options(myLat,myLon,num,stns):

    '''
    Background: this function will plot x number of the top stations that are closest to your location

    Args:
    myLat,myLon: your current latitude and longitude
    num: Number of stations you wish to plot on the map
    stns: df of stations (ie. distances_to_all)

    Return:
    folium_map: a map of the x number of stations added to the map

    '''
    # Get top x closest stations

    num = num - 1

    my_options = []

    x = 0

    while x <= num:
        stn_id = stns[x][0]
        stn_lat = stns[x][5]
        stn_lon = stns[x][6]
        stn_bikes = station_status_each[station_status_each['station_id'] == stn_id].copy()
        stn_bikes_avail = stn_bikes['num_bikes_available'].values[0]
        my_options.append([stn_id,stn_lat,stn_lon,stn_bikes_avail])

        if stn_bikes_avail == 0:

            # make circle red
            folium.CircleMarker(location=(stn_lat,
                        stn_lon),
                        color='#e6001c',
                        radius=5,
                        weight=1,
                        popup="Bikes Available: 0",
                        fill=True).add_to(folium_map)

        else:

            # make circle green
            folium.CircleMarker(location=(stn_lat,
                        stn_lon),
                        color='#6bdb6d',
                        radius=6,
                        weight=1,
                        popup=str("Bikes Available at STN #" + str(stn_id) + ": " + str(stn_bikes_avail)),
                        fill=True).add_to(folium_map)
        print(stn_id)
        x = x + 1


    return folium_map
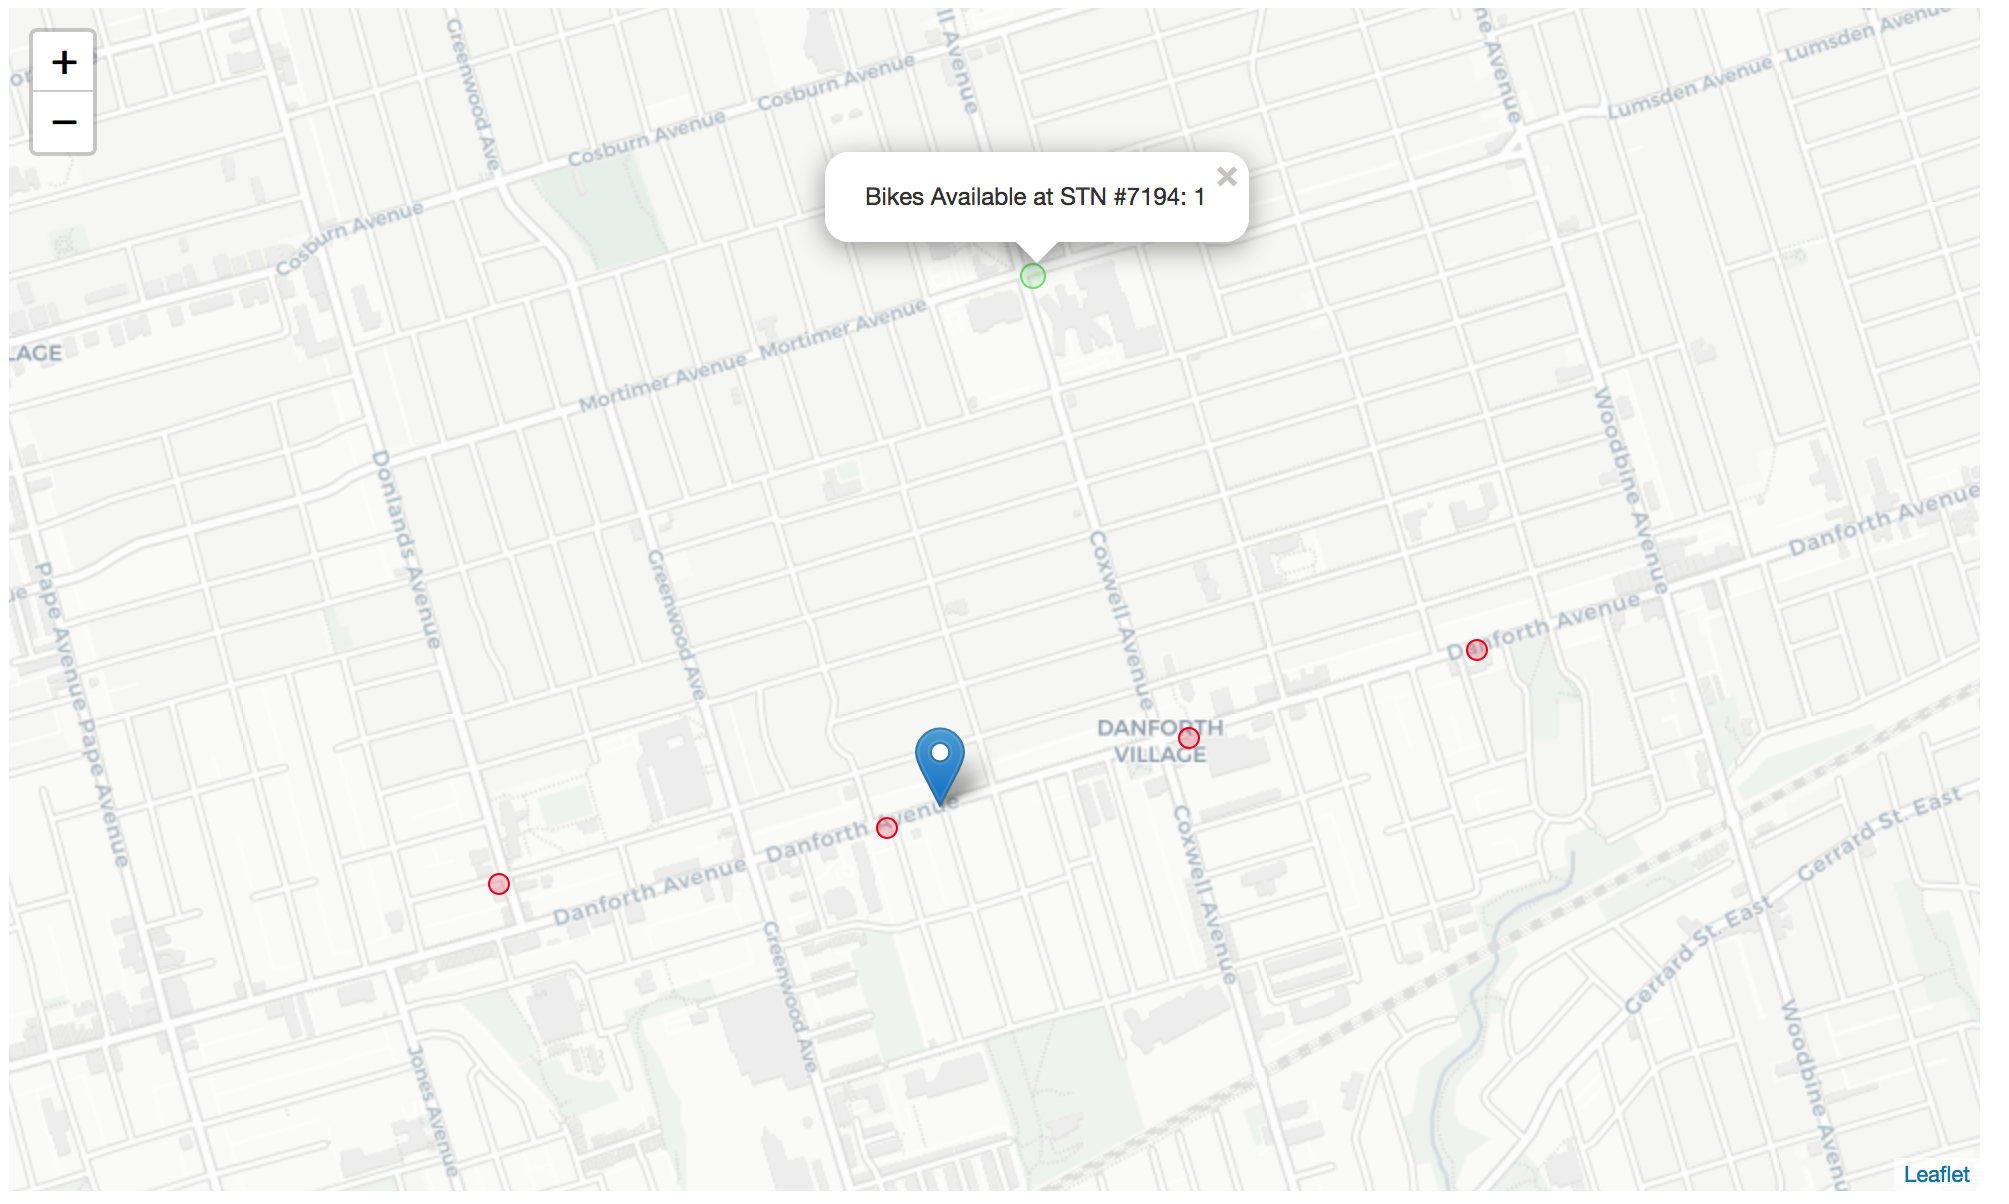
Let’s run it and return the top 5 stations closest to me.
plot_top_options(myLat,myLon,5,distances_to_all)
7090
7088
7091
7194
7087
Top 5 stations closest to me
It looks like 4 of the closest stations have no bikes available given there red colour status, but it looks like station #7194 has one available!
Now let’s draw a route on map to the green station. To do this, I’ll need to create a function that gets station #7194’s lat long and then pass that into another function that helps me plot the route to the station.
First, let’s get station #7194’s lat / long
def get_stn_lat_long(station_num):

    '''
    Background:
    Returns a specific station number's lat / long coordinates

    Args:
    station_num: station number needed to find their lat /long

    Returns:
    stn_lat: the station's latitude
    stn_lon: the station's longitude

    '''
    # filter stn_attr to station_num
    stn_info = station_attr[station_attr['station_id'] == station_num]
    stn_lat = stn_info['lat'].values[0]
    stn_lon = stn_info['lon'].values[0]

    return stn_lat,stn_lon
stn_lat, stn_lon = get_stn_lat_long(7194)
Now let’s create a function to plot a route to a desired set of coordinates.
def get_paths(myLat,myLon,closestLat,closestLon):

    """
    Background:
    This function will return the route in latitudes and longitudes in between our starting and ending trip points.

    Args:

    myLat: my current latitude
    myLon: my current longitude
    closestLat: closest latitude with available bikes > 1
    closestLon: closest longitude with available bikes > 1
    Returns:

    path_list: A list of lat long tuples for each trip.

    """

    coords = ((myLon,myLat),(closestLon,closestLat))

    # Specify your personal API key - visit openrouteservice.org/dev/
    client = openrouteservice.Client(key='{INSERT YOUR KEY}')
    geometry = client.directions(coords)['routes'][0]['geometry']
    decoded = convert.decode_polyline(geometry)

    # We need to reverse the long / lat output from results so that we can graph lat / long
    path_list = [(y, x) for x, y in decoded['coordinates']]
    print(path_list)

    return path_list
Ok. Now let’s get all of the latitudes and longitudes of the chosen route using the get_paths function.
chosen_route = get_paths(myLat,myLon,stn_lat,stn_lon)
Outputs:
[(43.68234, -79.32835), (43.68236, -79.32826), (43.6826, -79.32715), (43.68281, -79.32618), (43.68294, -79.32555), (43.68311, -79.32475), (43.68333, -79.32369), (43.68336, -79.32357), (43.68347, -79.32363), (43.6838, -79.32377), (43.68417, -79.32393), (43.68498, -79.32425), (43.68574, -79.32459), (43.6858, -79.32461), (43.68584, -79.32463), (43.68659, -79.32494), (43.68735, -79.32526), (43.68806, -79.32555), (43.68863, -79.32579), (43.68872, -79.32581), (43.68878, -79.32582), (43.68885, -79.32584), (43.68897, -79.32587), (43.68933, -79.32602), (43.69013, -79.32636), (43.69053, -79.32654), (43.6906, -79.32656), (43.69062, -79.32646), (43.69064, -79.32635)]
Now let’s plot the route using the chosen_route data that was just returned above.
# Plot Route on the folium map.
folium.PolyLine(
            chosen_route,
            weight=2,
            color='#0A8A9F',
        ).add_to(folium_map)
There it is! The route on the map! But wait…
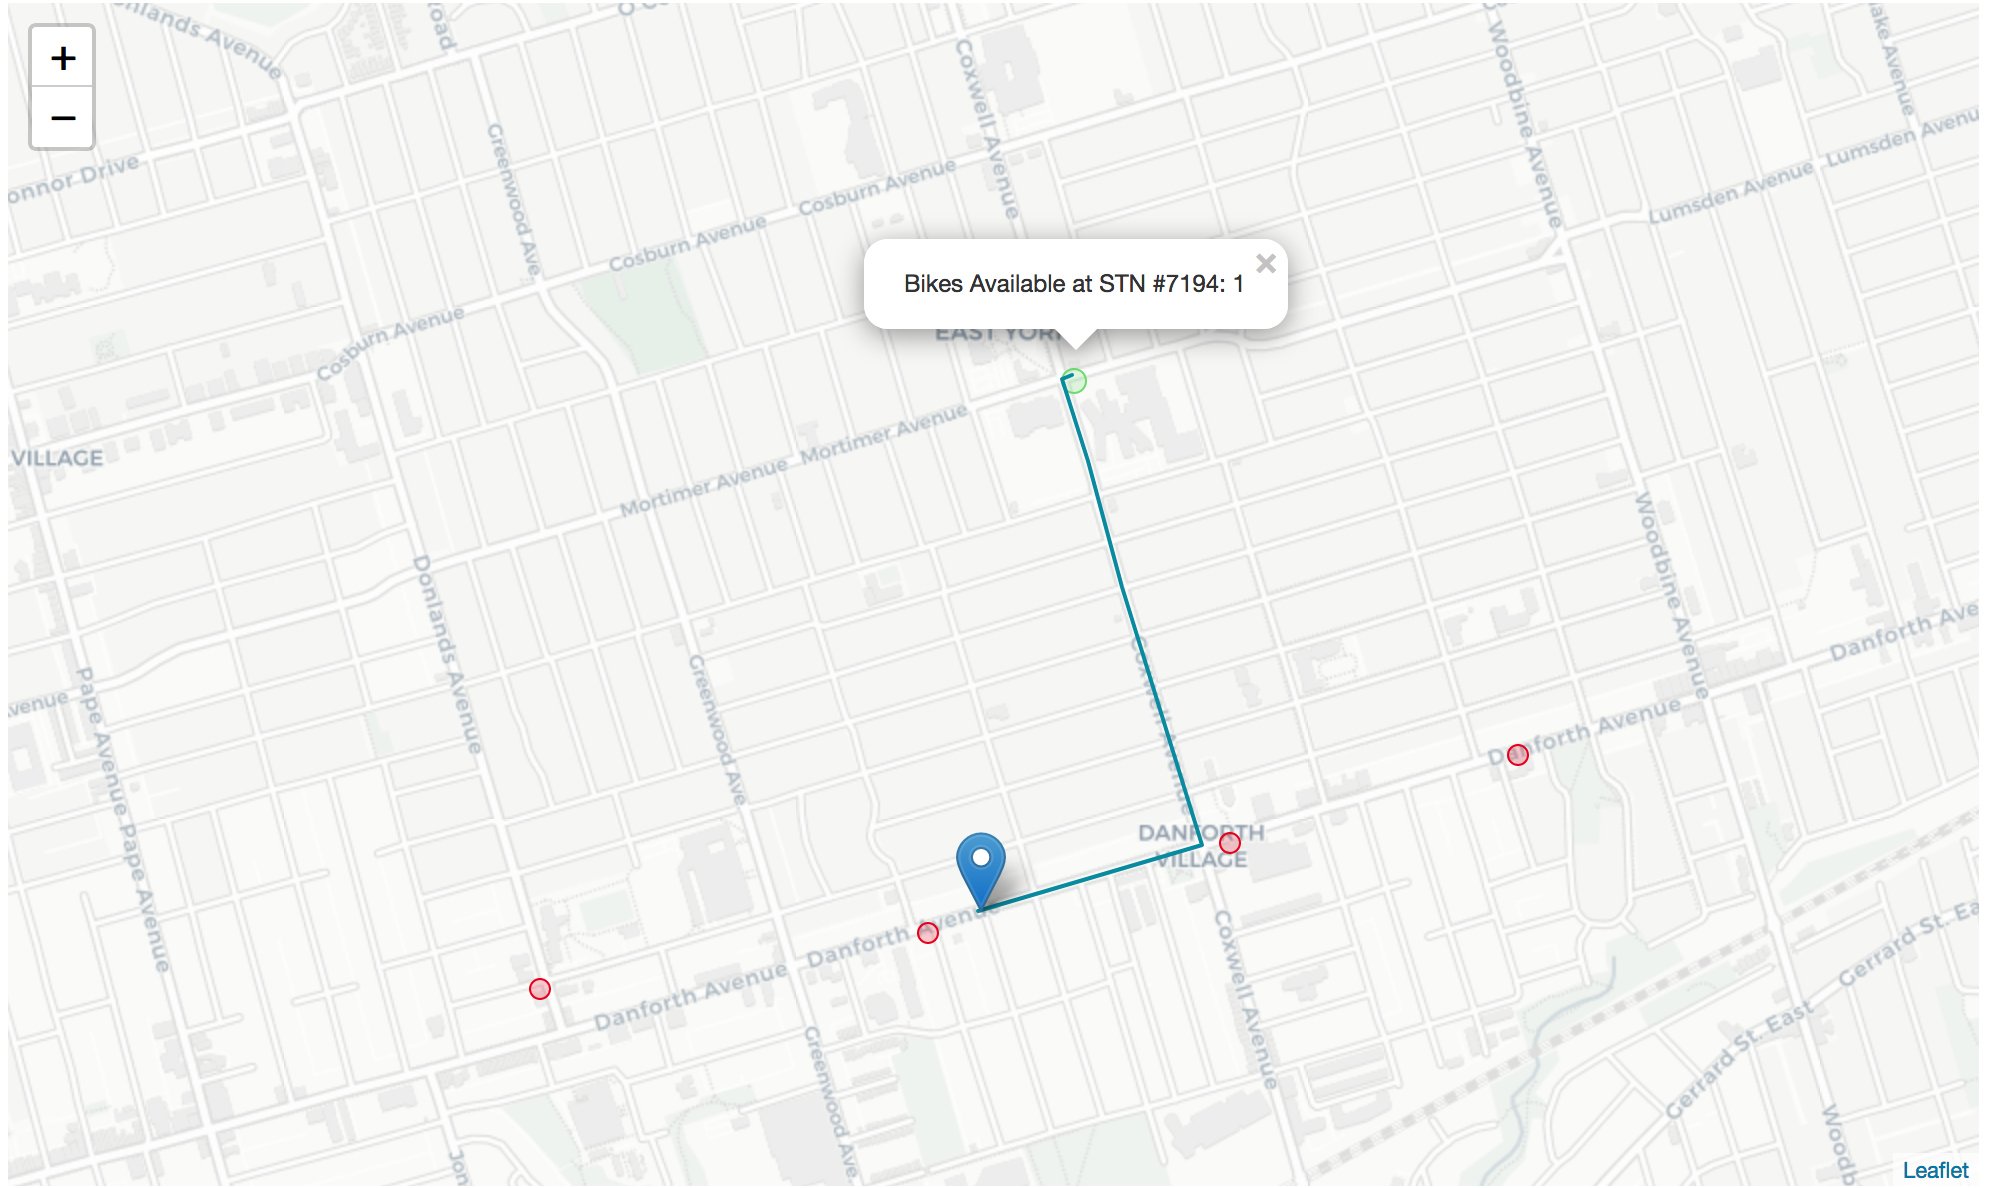
(Let’s save this map for later…)
folium_map.save(outfile='map.html')
Hmmm. Now that I’ve analyzed these results…
There is no way that I’m walking all the way up to the hospital to rent a bike. It’s a farther walk there then it is to my home!
I think I’ll pass on the bike share today and will just catch a Lyft home.
ABOUT THIS POST
As someone who loves running data-driven experiments and testing new ideas, I thought I’d try a new type of post which weaves a fun narrative around a ‘how to article’ detailing how to pull open data from the City of Toronto’s bike share program and determine the closest bike rack to your location (with at least 1 bike available to rent).
If you like it, please let me know in the comments below.
LINKS ON GITHUB
You can find all of the code from this post in the following jupyter notebook on github. Feel free to fork it and tweak as needed.
Comments